Your Clinic Revenue — Live, Explainable, In One Screen.
Real-time clinic revenue dashboard for Indian clinics — NexOPD. Track revenue, visits, patients & branch performance with trend charts, service breakdown, appointment heatmap & retention data.
Most Indian clinic owners run their practice on last month's tally sheet — with no way to see today's numbers moving in real time. NexOPD's revenue dashboard pulls consultation fees, procedure charges, and pharmacy billing into one live view — with date-range filters, per-branch breakdown, and trend charts that show exactly where the money is coming from (and where it isn't).
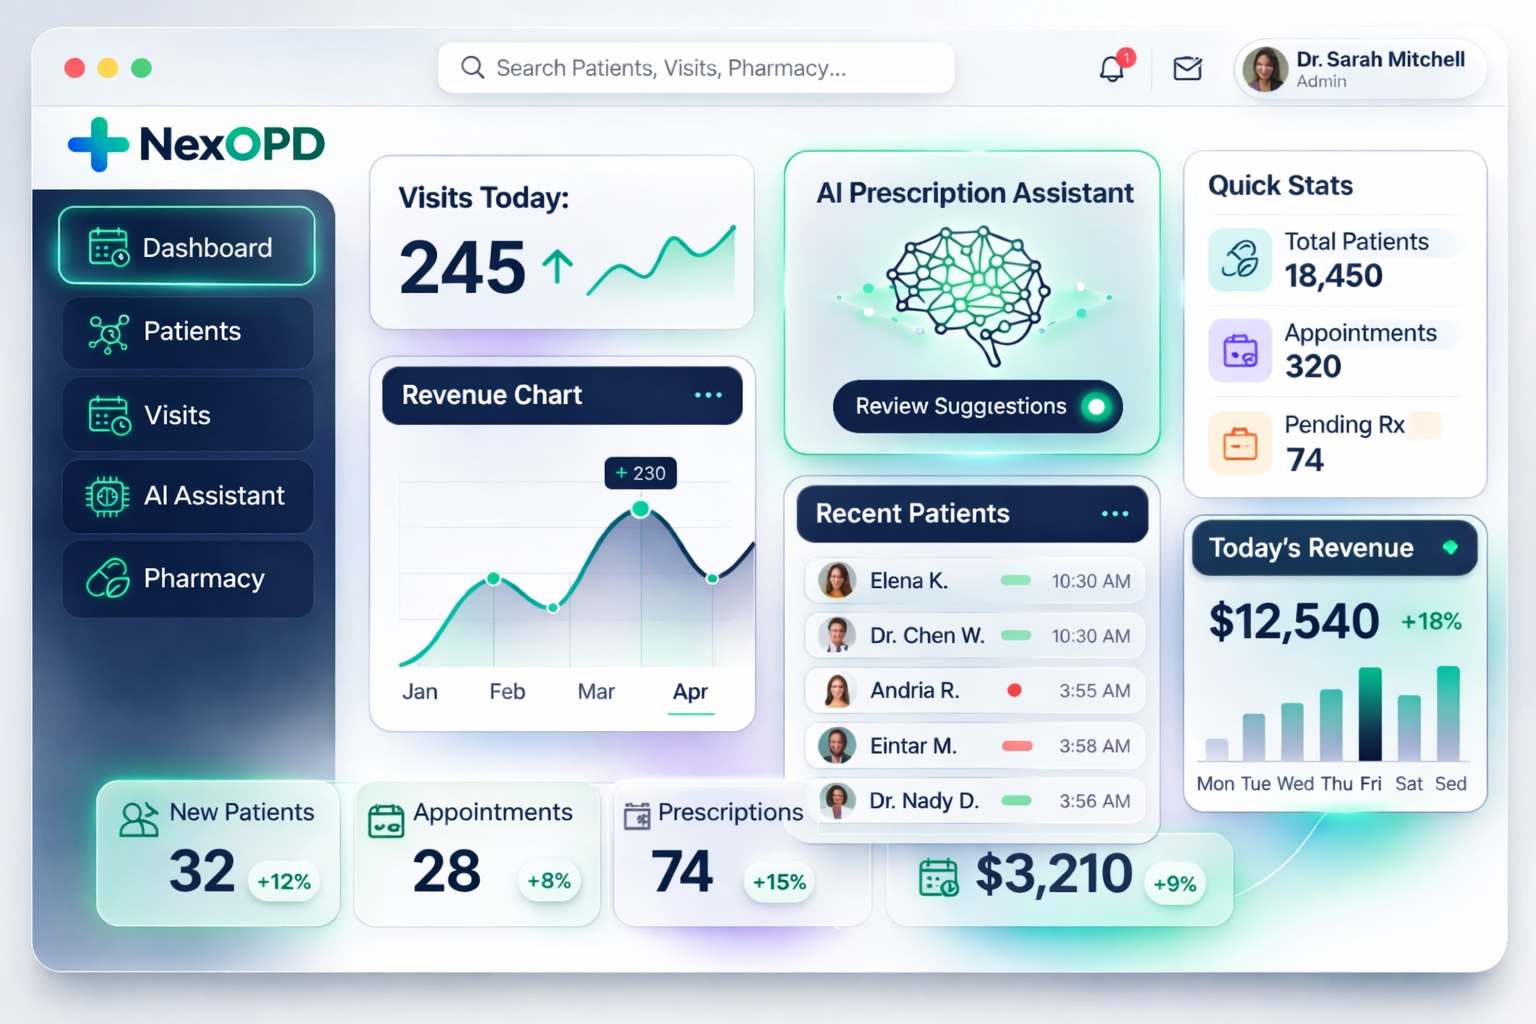
Every Rupee — Explained, in One Screen.
The dashboard aggregates revenue from consultations, procedures, and pharmacy billing across all your clinic locations — with a date-range picker (this month, last month, last 3 months, this year, or custom) and drill-down charts for every metric.
- Total revenue, visits, and new patients for the selected date range
- Per-branch leaderboard — see which location is pulling revenue
- Service revenue breakdown — consultation vs procedure vs pharmacy
- Appointment heatmap — busiest days and hours across the week
🔒 Secure · No Credit Card · Cancel Anytime
Everything included. Nothing extra.
Revenue, Visits & Patients — At a Glance
Top-line KPIs update in real time: total revenue collected, total visits, and new patient registrations for the selected date range. No manual tallies at month end.
Date-Range Filters
Preset ranges — this month, last month, last 3 months, this year — or pick a custom from-to date. Every chart, leaderboard, and metric reflects the selection instantly.
Branch Leaderboard
For multi-clinic setups, see revenue, visits, and patients per branch — ranked. Instantly spot which location is over-performing and which needs attention.
Revenue Trend Chart
A visual trend of daily revenue across the selected period. Spot dips, surges, and seasonal patterns without digging through spreadsheets.
Service Revenue Breakdown
See how much revenue came from consultation fees, procedures, and pharmacy billing — separately. Reveals which parts of your practice are actually paying.
Appointment Heatmap
A day-of-week × hour heatmap showing when patients actually book. Use it to adjust doctor availability and reduce unbooked slots.
Patient Retention & Lapsed Alerts
Track how many patients returned vs how many lapsed (30, 60, or 90 days without a visit). Every lapsed patient is a follow-up call worth making.
One-Click CSV Export
Export any analytics view to CSV in one click — for your CA, monthly closing, or offline analysis. A daily visits CSV with payment mode and net collected is also available.
Numbers That Actually Change Decisions.
Most clinic dashboards show numbers you already knew. NexOPD's revenue dashboard surfaces the ones you didn't — the lapsed-patient count that hasn't called back, the branch whose Tuesday afternoons are empty, the service line whose margin dropped this month. Every metric is drillable, exportable, and updates the moment a bill is created.
Related Resources
Frequently Asked Questions
Ready to transform your clinic?
Start free today — no credit card, no installation, no IT team required.
🔒 Secure · No Credit Card · Cancel Anytime