Most Indian clinic owners run their business on a lag. They know how March went in April, when the accountant closes the books. They know Tuesday was slow — but only on Wednesday morning when they ask the receptionist. This lag is expensive. Every day you're not looking at revenue is a day you can't react to it. A real-time revenue dashboard closes that gap and turns a clinic from a place you run by feel into a business you run by number.
Why Real-Time Revenue Visibility Matters for Clinic Owners
Clinic finances have three qualities that make real-time data especially valuable:
- Cash-heavy, high-transaction: A 40-patient OPD generates 40–60 individual money-in events every day between consultation fees, pharmacy sales, and procedure charges. Waiting for month-end to see the pattern means missing 25+ signals a day.
- Multiple revenue streams: Consultation fees, in-house pharmacy, diagnostics, procedures, package plans. Each behaves differently. Aggregated month-end totals hide which stream is up and which is quietly leaking.
- Small operational levers move revenue fast: Adding a slot, extending pharmacy stock hours, cutting a doctor's off-day, running a WhatsApp reactivation blast — all can change tomorrow's revenue. But only if you know today's number.
The clinic owners who look at their revenue dashboard every morning make different decisions than those who look at it every quarter. Better decisions, on average, and much earlier.
What a Good Clinic Revenue Dashboard Should Show
Not every "dashboard" is useful. Many clinic software vendors slap five pie charts on a page and call it done. A dashboard that actually helps a clinic owner run their business surfaces the following numbers in real time:
Top-Line Cards (Today, at a Glance)
- Today's revenue vs same day last week and last month
- Patients seen today vs booked and vs same day last week
- Average bill value today — a fast leading indicator of pricing and product mix
- Outstanding dues collected today
- Live no-show rate for today's remaining slots
Trend Charts (This Week / This Month)
- Daily revenue for the last 30 days, with 7-day moving average
- Revenue split by stream — consultation, pharmacy, procedures, packages
- Revenue by doctor (for multi-doctor clinics)
- Revenue by clinic location (for multi-clinic owners)
- New patient vs returning patient revenue mix
Actionable Alerts
- Days trending 20%+ below the rolling average
- Doctors whose average consultation fee dropped week-over-week
- Pharmacy items with high margin whose sales dropped this week
- Outstanding dues aged 30/60/90 days
- Chronic patients due for a review who haven't booked
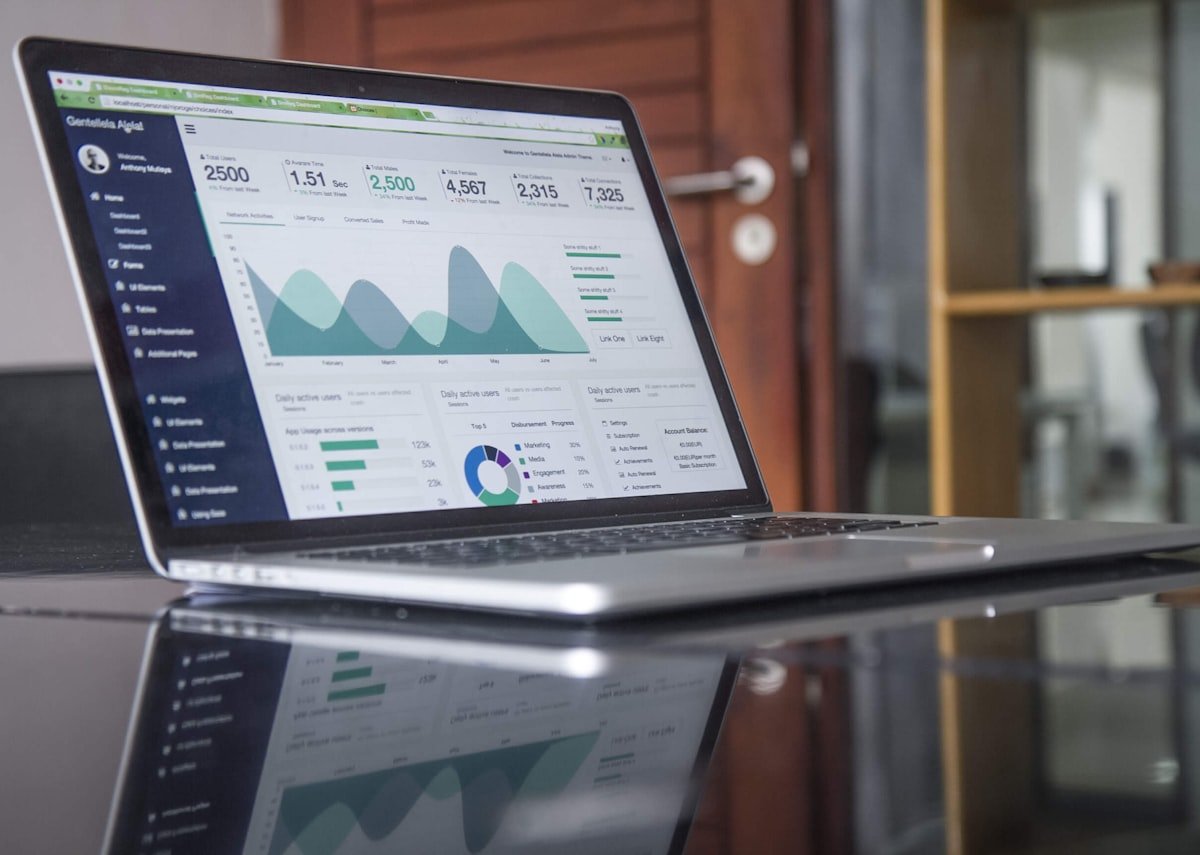
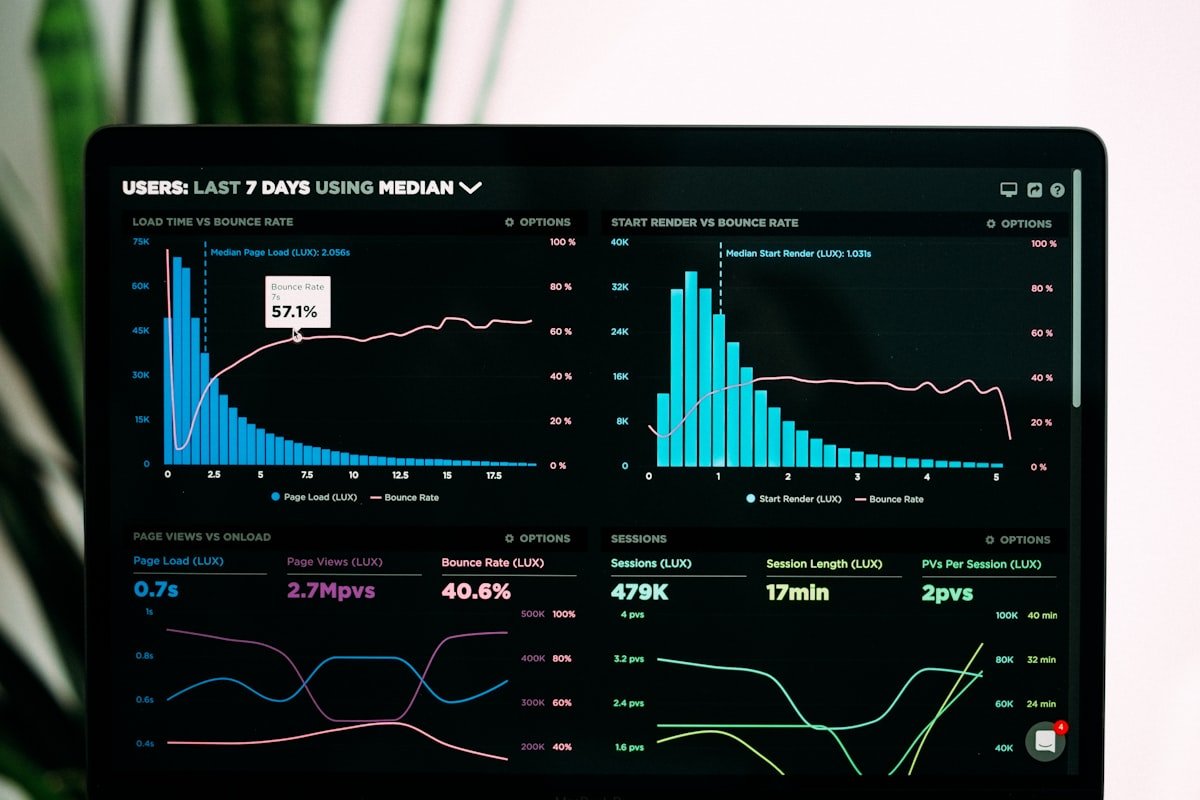
NexOPD's revenue dashboard is built around exactly this structure — a top-line summary card row, drill-down trend charts, and an alerts feed that surfaces the numbers that need attention today.
How Clinic Owners Actually Use Real-Time Revenue Data
1. The 9am Morning Check
Most NexOPD clinic owners open the revenue dashboard first thing every morning — before the first patient walks in. The check takes 60 seconds:
- What did yesterday do vs the day before?
- What's booked for today, and what's the expected revenue at typical bill value?
- Any red flags in the alerts feed?
That single 60-second glance sets the tone for the day. If bookings are thin, the receptionist runs a WhatsApp reactivation blast before 10am. If a doctor's slot is 60% empty, the owner asks why. Small course corrections happen the same day rather than three weeks later.
2. The Monday Weekly Review
Once a week, most owners spend 15 minutes on a slightly deeper review:
- Which day of last week was the highest revenue? Why?
- Which stream grew fastest? Which shrank?
- Are outstanding dues creeping up?
- Which patients haven't returned when they should have?
This is where real-time data compounds. Weekly patterns become obvious after 4–6 weeks of consistent looking. Owners spot things like "Wednesdays are our worst day because Dr. Sharma takes half-day" or "pharmacy revenue tanks whenever we run out of Rosuvastatin".
3. Reacting to Live Bookings Mid-Day
The dashboard updates in real time. If it's 2pm and only 12 of 30 booked patients have arrived, the receptionist can see it, send a batch reminder, and pull the no-show rate down before the day is written off. Decisions that used to happen tomorrow now happen inside the day itself.
4. Multi-Clinic Owners: One Screen, All Locations
For owners running 2–5 clinics, the dashboard consolidates every location on one screen. Total revenue today across all clinics. Which location is up, which is down, which doctor is overbooked, which is idle. This visibility is transformative — most multi-clinic owners were previously running each location as a separate business because they simply couldn't see them together.
Real Numbers: What Owners See in the First 90 Days
Here's what typically shifts when a clinic owner starts checking their revenue dashboard every day:
| Metric | Before daily dashboard use | After 90 days |
|---|---|---|
| Days it takes to react to a slow week | 10–20 days (by month-end) | Same day / next day |
| Average outstanding dues aged 60+ days | 15–25% of monthly billing | 4–8% of monthly billing |
| Detection of doctor-wise revenue drop | Rarely spotted before quarter-end | Within the same week |
| Monthly revenue growth rate | Flat to +2% | +6% to +12% (typical NexOPD clinic in first year) |
| Time spent on manual MIS reports | 4–8 hours per month | Zero (dashboard replaces them) |
The growth number needs a caveat: revenue rises because the owner starts making better decisions faster, not because the dashboard itself creates patients. But that compounding effect is real and it's why clinic owners who take dashboards seriously outperform those who don't.
What to Insist on When Choosing Clinic Software with Analytics
Not all clinic dashboards are created equal. Before you commit to any software, verify these:
- True real-time data — not "updated overnight". Every bill saved should reflect on the dashboard within seconds.
- Mobile-friendly view — owners check dashboards from a phone, often between clinics. If the dashboard only works on desktop, it won't be used daily.
- Drill-down capability — you should be able to click a revenue number and see the underlying bills that make it up.
- Doctor-wise, clinic-wise, service-wise splits — aggregate totals don't help you fix anything.
- Comparison to historical periods — the same number is good or bad only in context.
- Data export — CSV or PDF export for your CA at month-end. See our guide on clinic GST billing in India for how this ties into filings.
- Configurable alerts — you set the thresholds; the software watches them for you.
NexOPD is built to meet all of the above and is priced within reach of even small solo clinics. See how it compares to alternatives in our review of the best OPD software in India for 2026.
Common Objection: "I Already Know My Numbers"
Many clinic owners believe they have a sense of the business. They usually do — for the top-line monthly total. The gap opens up on the sub-numbers:
- What's your average consultation fee today, and how has it moved in the last 30 days?
- Which doctor generated the highest revenue per hour last week?
- What's your outstanding dues aged over 60 days, right now?
- What's your reactivation rate for patients who last visited 6–12 months ago?
Almost no clinic owner can answer these without pulling data. The dashboard makes all four of them visible in five seconds. That's the difference between "knowing your numbers" and running the clinic like a business.
Frequently Asked Questions
Do I need an accountant to use a revenue dashboard?
No. The dashboard is designed for the clinic owner, not the accountant. The numbers are presented visually with clear labels — total revenue today, per doctor, per service. Your accountant still handles GST filings and audits, but the day-to-day view is yours.
Can I access the dashboard on my phone?
Yes. NexOPD's dashboard is fully responsive and works cleanly on any smartphone browser. A dedicated mobile app is also available.
How does the dashboard handle cash vs UPI vs card revenue?
Each payment mode is captured at billing time and split out in the dashboard. You can see today's cash collection, UPI collection, card collection, and pending dues on one screen — critical for cash reconciliation at day-end.
Can I share the dashboard with a partner or investor without giving them full clinic access?
Yes. NexOPD supports role-based access. You can grant a partner "dashboard-only" access — they see revenue, patient counts, and trends but cannot see clinical records, patient contact details, or edit any data.
What if I run 3 clinics? Do I need 3 dashboards?
No. Multi-clinic owners get a consolidated dashboard with each location as a filter. Switch between "all clinics" and any single location in one click. This is one of the highest-value features for owners with more than one location.
Start Monitoring Your Clinic in Real Time
NexOPD's revenue dashboard is included on every paid plan. The free plan includes a simplified version so you can try the workflow before upgrading. Setup takes under 30 minutes — as soon as your first bill is saved, the dashboard begins populating.
Create your free NexOPD account and stop running your clinic on last month's data.